Candlesticks, volume and trend: reading a price chart for the first time
A chart is a record of what other people paid, nothing more. How to read one candle, why volume tells you more than most lines, what a trend is, and SEBI's own numbers on how intraday traders actually do.
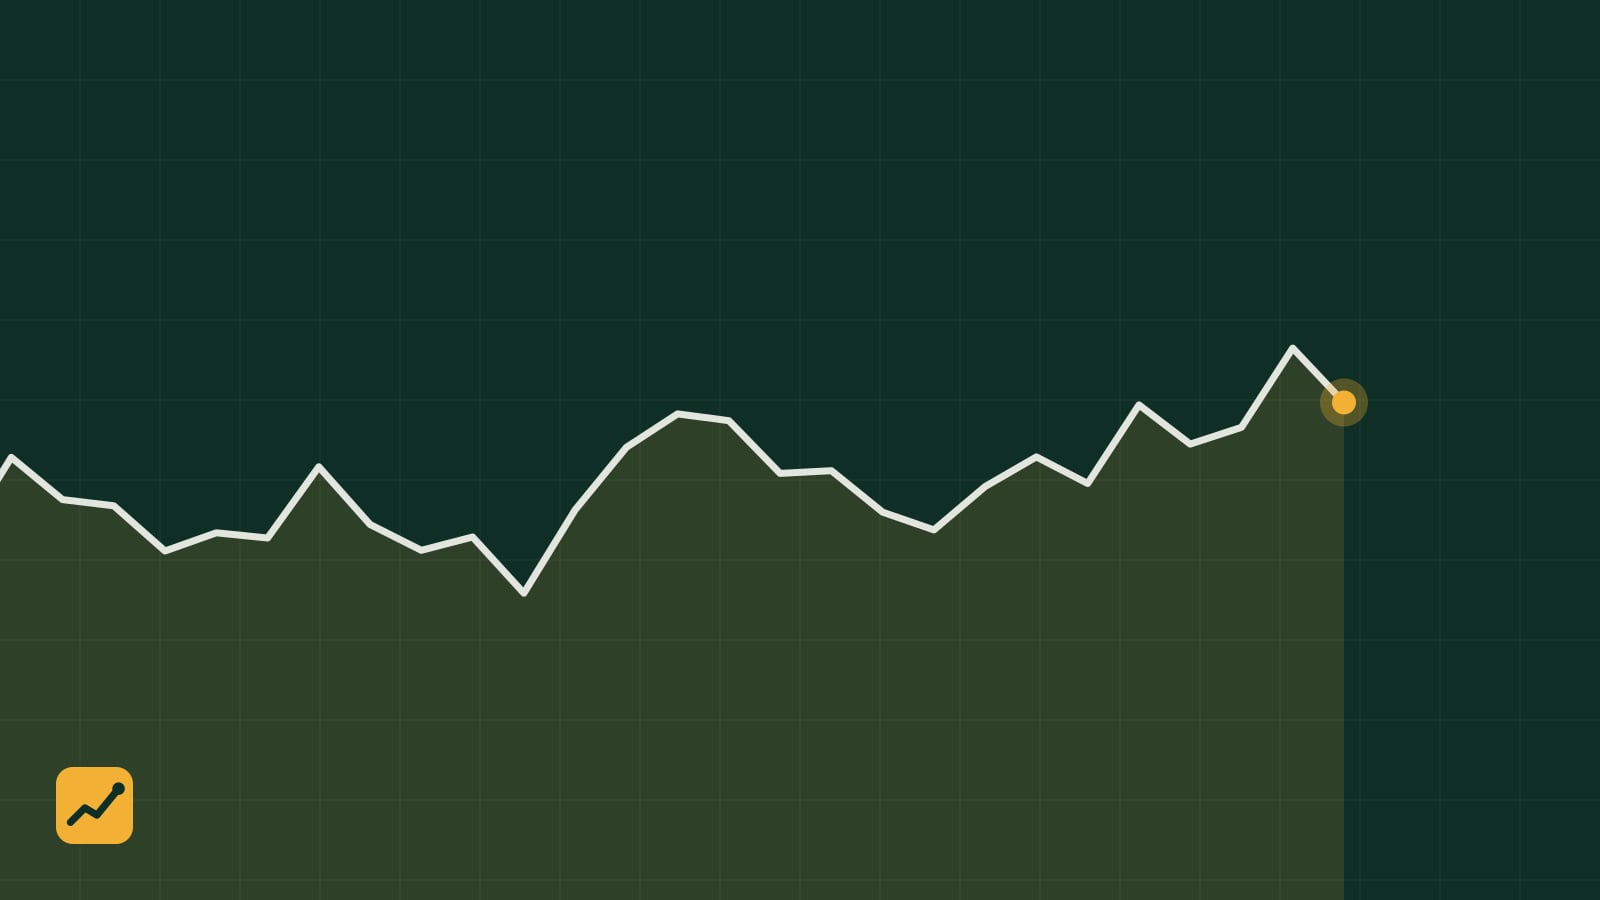
A price chart is the most seductive object in investing. It looks like data, it moves, and it seems to be telling you something. It is telling you something, just less than it appears to. A chart is a diary of transactions: at this time, somebody paid this much. It knows nothing about the company’s debt, its auditor or its customers. Learn to read it for what it is and it becomes useful. Read it as a crystal ball and it becomes expensive.
One candle
Open any stock on your broking app and switch the chart to candlesticks. Each candle summarises one period of trading, a day on the default view. The thick body runs from the opening price to the closing price. The thin lines above and below, the wicks, mark the highest and lowest prices touched in between.
Colour tells you direction. A green candle (blue on some Indian apps) closed higher than it opened; a red one closed lower. A long body means a decisive day. A tiny body with long wicks means buyers and sellers fought to a draw. That is all a candle is. The dozens of named patterns, hammers and dojis and engulfing bars, are just vocabulary for shapes, and their predictive record is far weaker than the books about them suggest.
Timeframes change the animal
The same share looks like three different things on a five-minute chart, a daily chart and a weekly chart. On the five-minute chart it is a nervous wreck. On the weekly chart it is a slow, mostly rising line. Neither view is more true; they answer different questions.
If you are buying shares to hold for years, look at daily and weekly candles. The five-minute chart is for people trading in and out within the day, and we will come to how that group does.
Volume, the line most people ignore
Under the candles sits a row of bars showing how many shares changed hands each day. This is the most informative thing on the screen, and beginners switch it off because it clutters the view.
A price rise on heavy volume means many people agreed to pay more. A price rise on thin volume means a few people did, and the move reverses easily. The same logic applies to falls. When a share breaks above a price it has struggled with for months, check the volume; a breakout on twice the average volume is a different event from one on half of it. Volume also spikes around results and big announcements, and a spike with no public news is worth a question.
What a trend is
An uptrend is a sequence of higher highs and higher lows: each rally goes a little further than the last, and each dip stops a little higher. A downtrend is the reverse. Most of the time a share is in neither, drifting sideways.
Moving averages smooth the noise. The 50-day and 200-day averages are the common ones, and a share trading above a rising 200-day average is, by a reasonable definition, in a long-term uptrend. You will hear about the “golden cross”, when the 50-day crosses above the 200-day. It is folklore with a weak statistical record, mostly because by the time two slow averages cross, the move that caused it is largely done.
The honest statement about trends is this: they persist more often than pure chance would suggest, but not reliably enough to bet on without a plan for being wrong.
Support and resistance, correctly understood
Support is a price area where a share has stopped falling before; resistance is where it has stopped rising. People treat these as laws of physics. They are closer to memory. Many investors bought near a particular price and will sell with relief when it returns; others missed a rally and will buy if the share dips back to where they wished they had bought. That is all a support zone is, and it works until the number of people with that memory runs out.
The practical use is not prediction. It is placement. If you decide to buy a share at 500 because you like the business, a chart shows you that it has bounced at 460 three times in the last year, which gives you a sensible place to admit you were wrong. The Advanced lesson on position sizing turns that into a number of shares.
What the regulator found
In July 2024 SEBI published a study of individual investors trading intraday in the equity cash segment. About seven in ten of them lost money in the financial year 2022-23. The more often someone traded, the more likely they were to lose; among the most active traders the loss-making share was higher still. The number of young traders had grown fastest. SEBI’s separate study of futures and options traders, which the Advanced course covers, found a worse picture.
That is the cold water. Most of the people reading five-minute charts with twelve indicators are losing, after costs, to the small minority who are better resourced, faster and often not human. A chart is not where retail investors have an edge.
Where a chart does help an investor
Three places. First, timing an entry into a company you have already researched: buying on an ordinary pullback rather than chasing a share that rose 30 percent last week does not change the business, but it changes your price. Second, setting an exit for when you are wrong, as above. Third, noticing distribution: when a share drifts down on rising volume for weeks before a results announcement, somebody knows something, and you should at least reread the last annual report before adding.
None of these requires an indicator. Candles, volume and a 200-day average are enough.
Try this before moving on
Pull up a one-year daily chart, with volume, for one of your three companies. Mark the three days with the biggest volume bars. Then search the news for each of those dates. You will find the results announcement, the block deal or the rumour that caused each spike, and you will have learned the thing charts are actually good for: pointing at the day something happened, so you can go and find out what.
You can now
- Read a single candle: open, close, high and low.
- Use volume to judge how much a price move means.
- Use a chart to place an exit, not to predict the future.
Quick self-check
3 questionsAnswer in your head first, then tap a question to see ours.
Q1A candle is red with a long lower wick. What happened that day?
The share closed below where it opened, and at some point it traded well below the close before buyers pushed it back up.
Q2A share breaks above a price it struggled with for months, on half its usual volume. How much weight should you give the breakout?
Little. Few people agreed to pay the higher price, and thin moves reverse easily.
Q3What did SEBI find about individual intraday traders in 2022-23?
About seven in ten lost money, and the more often they traded, the more likely they were to lose.
Keep reading
Also on Bazaar School
P/E, P/B and ROE: three ratios that do most of the work
You do not need forty ratios. You need three, the arithmetic that connects them, and a list of the ways each one lies. With a worked example and the questions to ask before trusting any number an app shows you.
How to read an annual report without falling asleep
A listed company's annual report runs 200 to 400 pages, and most of it is there to be skipped. The order to read it in, the six pages that matter, and the warning signs that sat in Satyam's reports before anyone looked.
How to read an annual report in 20 minutes with AI, and not get fooled by it
A step-by-step workflow for letting a language model do the page-turning on a 300-page annual report: the prompts, the extraction table, the verification pass that catches invented numbers, and the questions a model cannot answer for you.